Sales Insights Dashboard
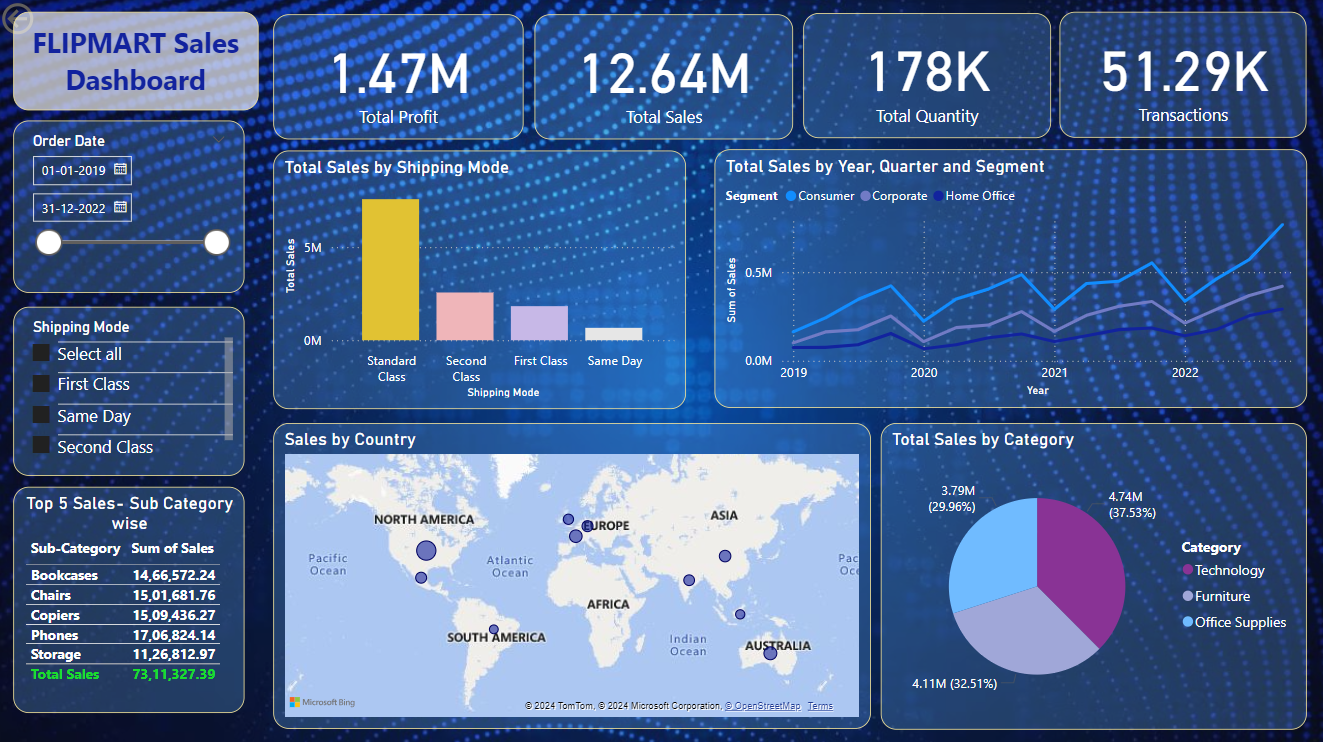
This Power BI dashboard provides insights into sales performance across different regions, product categories, and time periods. The key findings include:
The visualizations are designed to give actionable insights for the marketing and sales teams.