Key Insights:
The dashboard provides a comprehensive view of supplier quality and its correlation with defect rates. It includes various visualizations that offer insights into overall performance, trends over time, and relationships between different metrics.
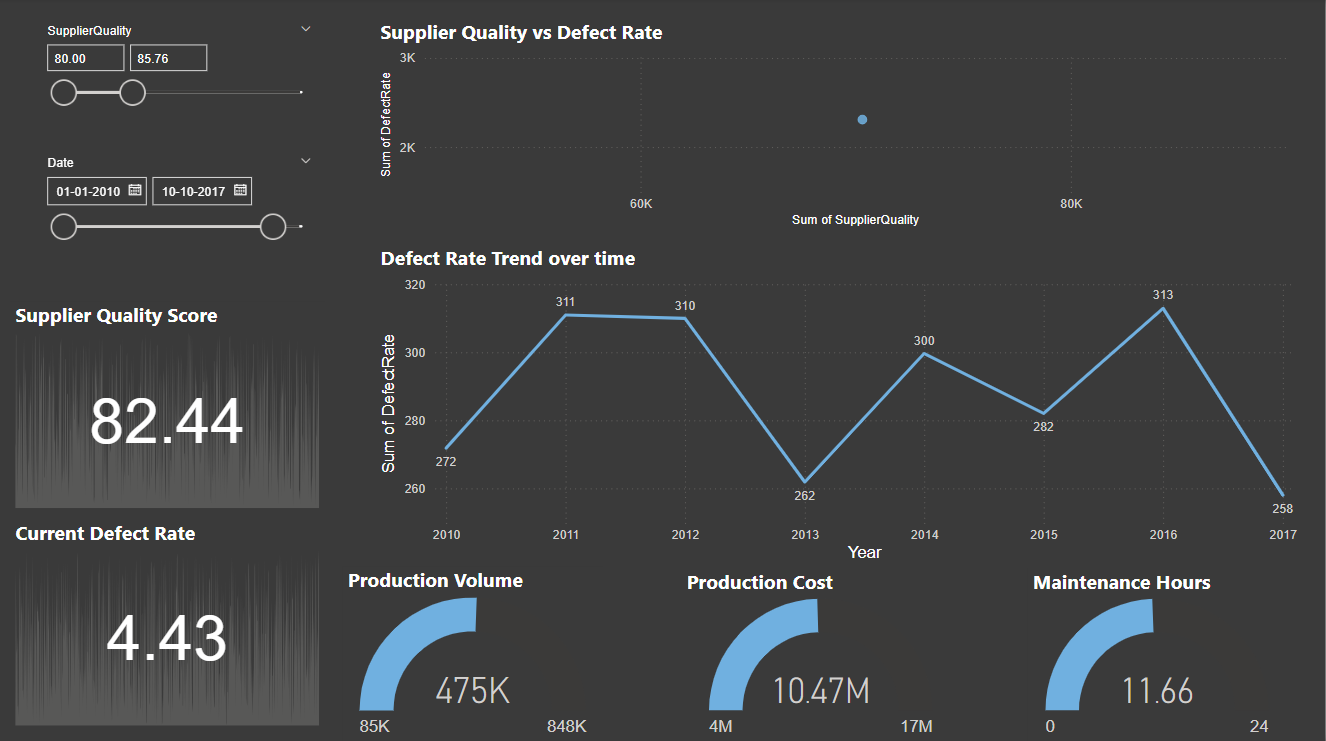
- Supplier Quality: The overall supplier quality score is 82.44, indicating a generally good performance. However, there's a significant range in scores (80.00 to 185.76), suggesting a need for more consistent quality management across suppliers.
- Defect Rate Trend: The defect rate has fluctuated over the years. Periods of improvement are followed by increases, indicating a need for ongoing quality control to address root causes and maintain consistent performance.
- Supplier Quality vs. Defect Rate: A general inverse relationship exists between supplier quality and defect rate. As supplier quality increases, defect rates tend to decrease, although the relationship is not perfectly linear.
- Production Metrics: The production volume and cost have generally increased over time. While no clear correlation with defect rates has been established, further exploration may reveal production's impact on quality.
- Maintenance Hours: Maintenance hours have increased steadily, possibly to support higher production or address equipment issues.
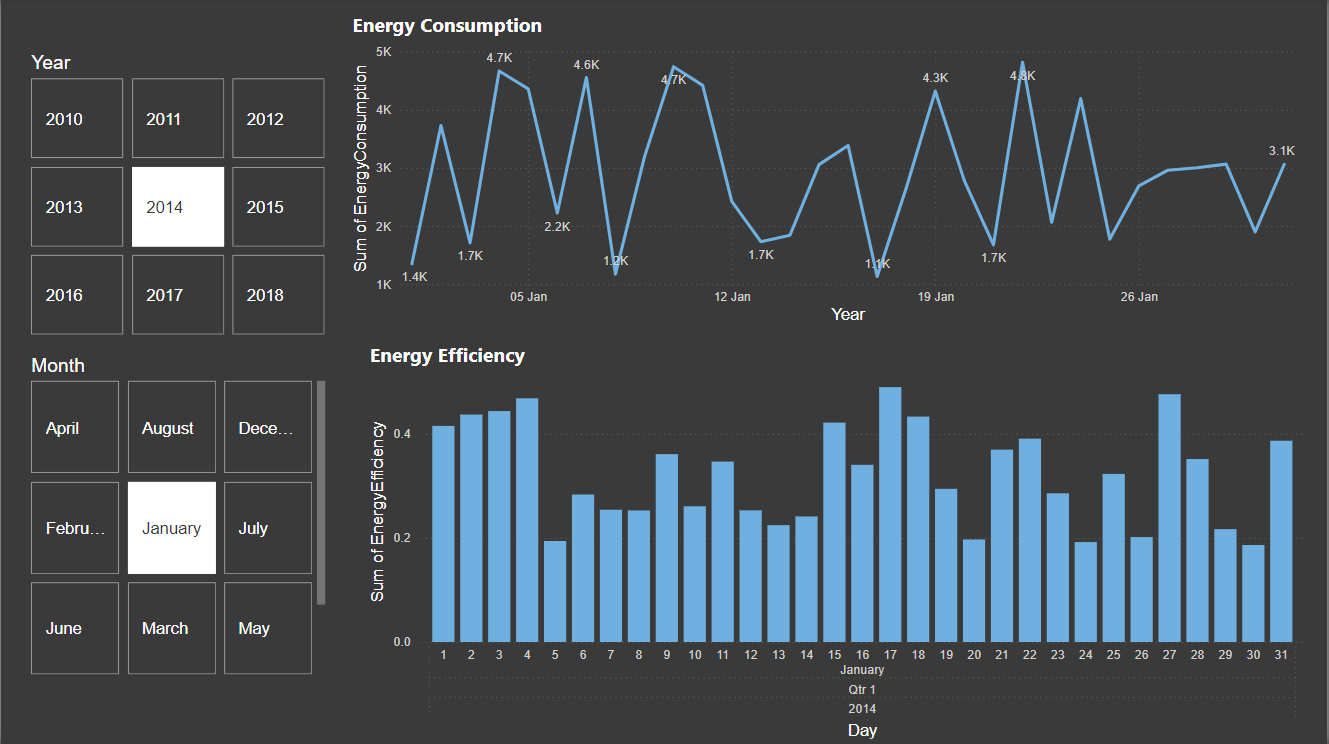
- Energy Consumption: The energy consumption has shown a general upward trend, with peaks in 2012 and 2014, requiring further analysis to optimize efficiency.
- Energy Efficiency: Energy efficiency varies across months, with higher efficiency in January and August, and lower efficiency in April and December.
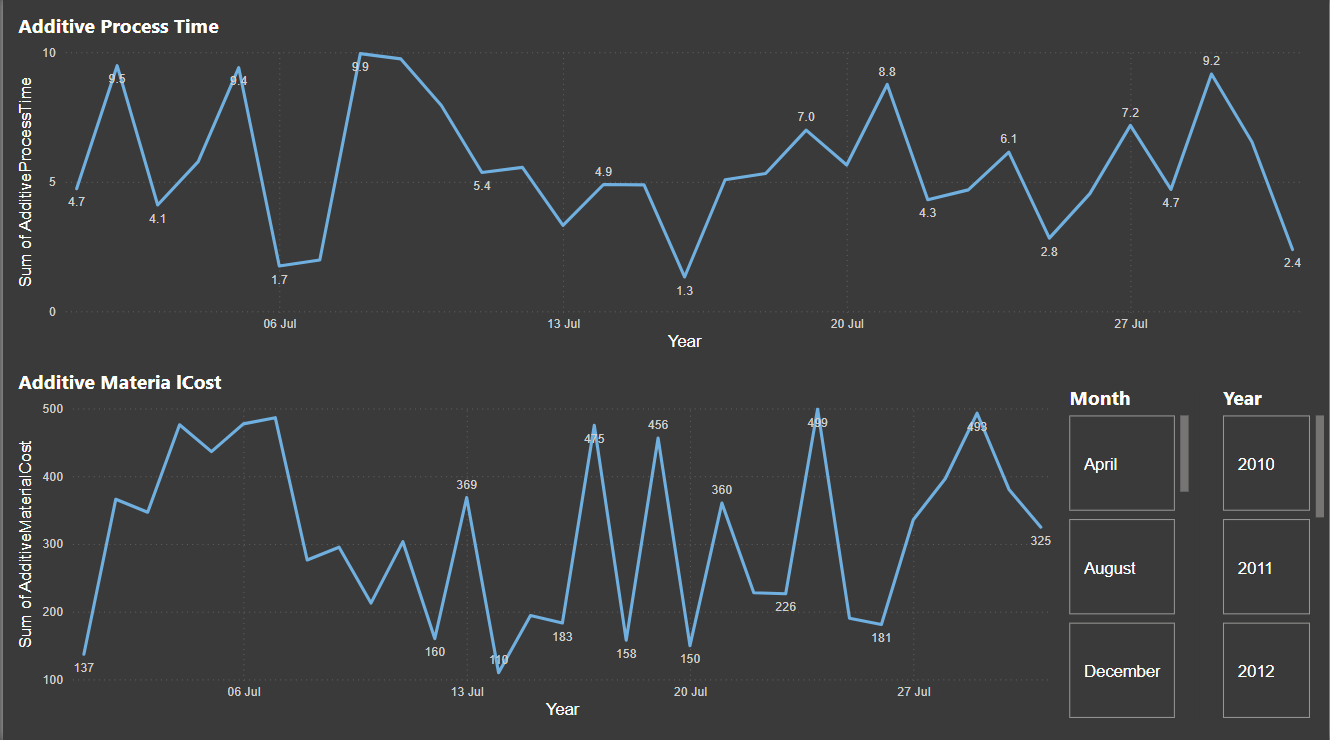
- Additive Process Time: Fluctuations in additive process time suggest variations in efficiency and complexity over the analyzed period.
- Additive Material Cost: Additive material costs follow a similar fluctuation pattern, potentially influenced by factors such as material type and usage patterns.